

U.S.
Based

Veteran
Owned
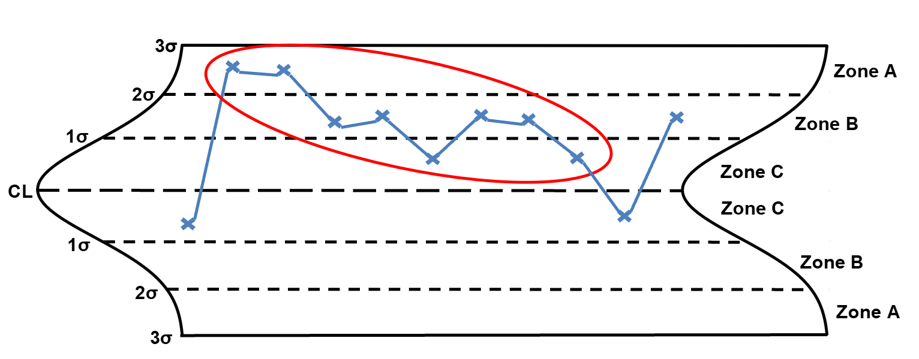
Learn how to use control charts to understand process performance and recognize when something needs attention. This self-paced course explores chart types, process variation, control limits, and how to interpret patterns that may call for investigation.
Whether you work in quality, manufacturing, engineering, or process improvement, you’ll build practical skills for making informed decisions using your process data. Complete the course and pass the final exam to earn your Certificate of Completion.
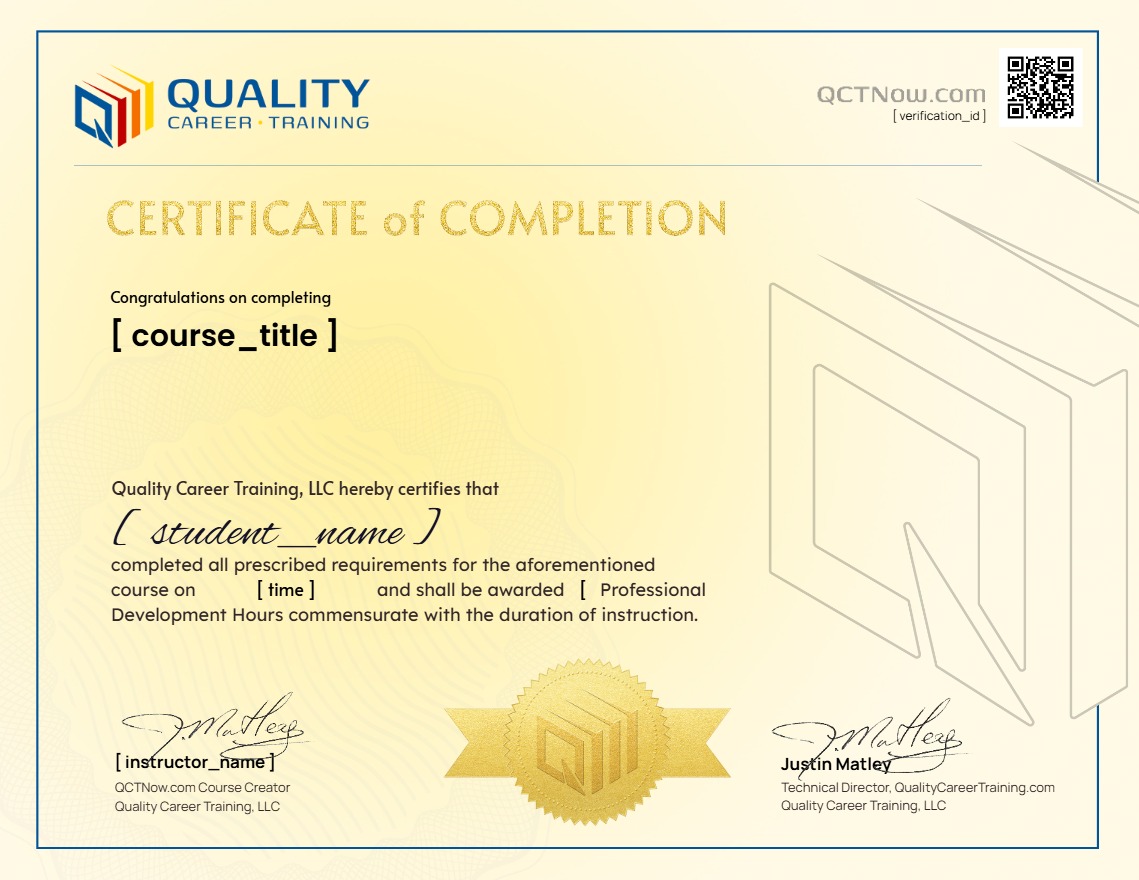
Add this certificate to your resume to demonstrate your skills & increase chances for hiring and promotions.

Want to receive push notifications for all major on-site activities?